
First things first, what is a histogram? It is a graph that shows how many pixels are at each value from black (the left side) to white (the right side). You can also have one that shows how the reds, blues or greens are distributed as well. The shape that you want this graph to make always depends on what you are shooting.
I thought the best way to show how I use the histogram is to show some of my histograms. Crazy? Maybe.
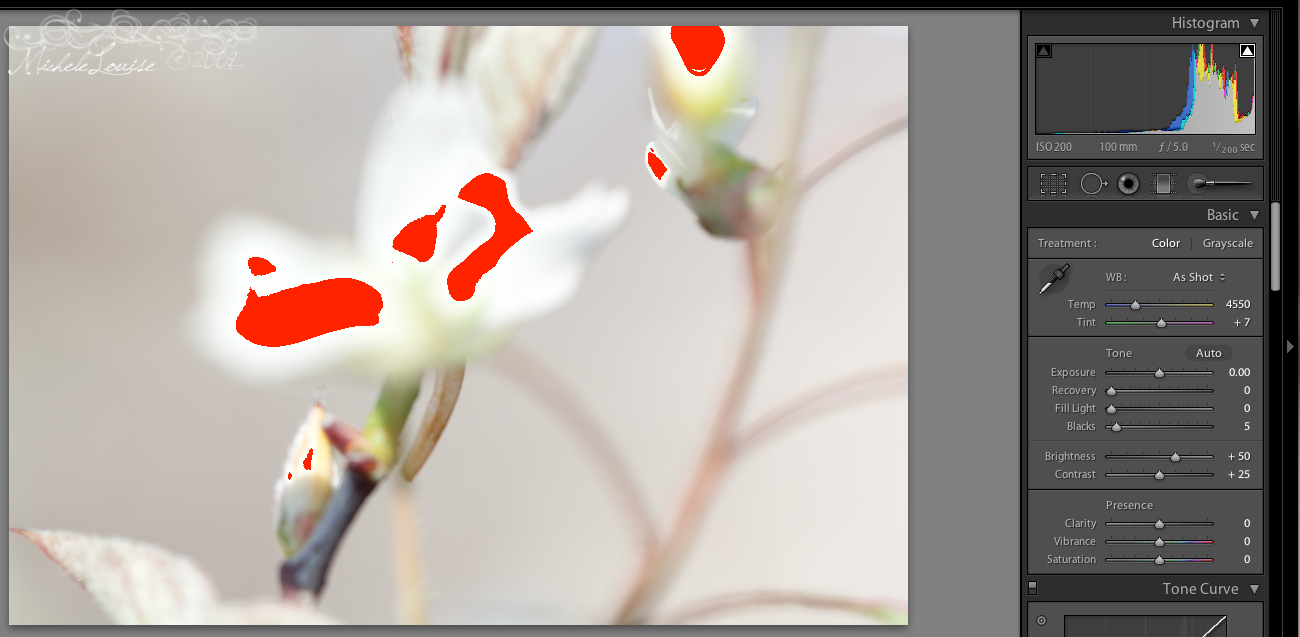
Going back to the images from the last post. This first shot was overexposed, you can tell by looking at the peak running up the right side of the histogram next to the image. I also turned on the function in LR that turns blown out highlights like these red. Click on image to see a larger version.
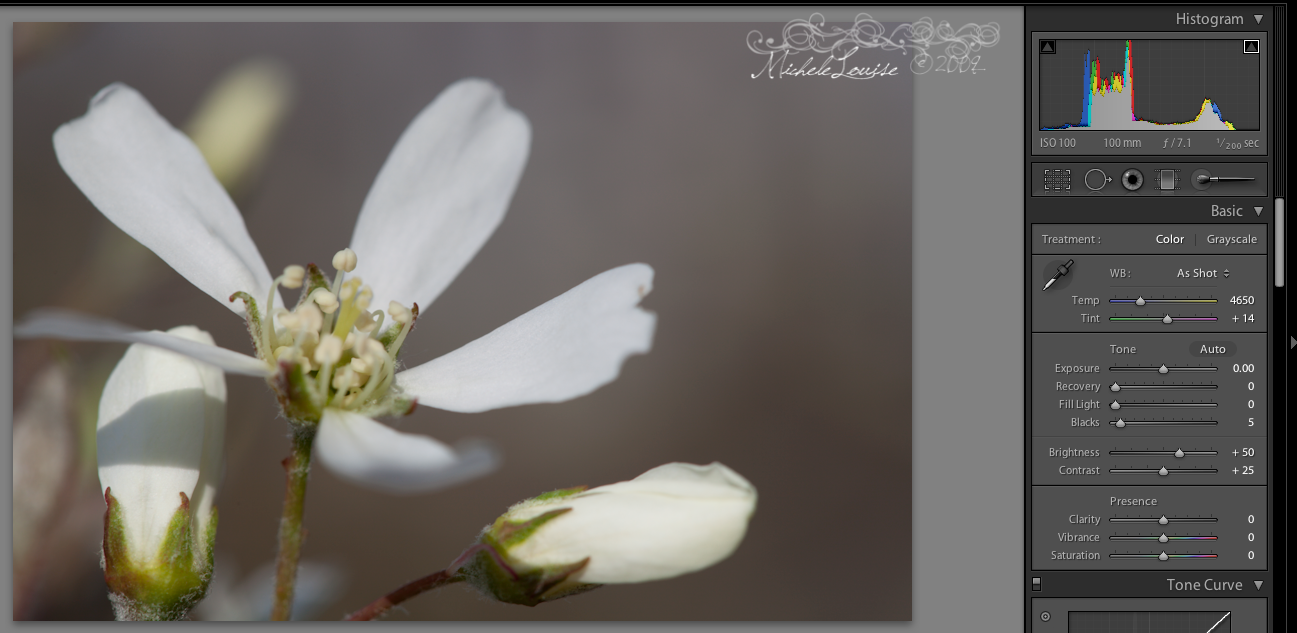
Here is the second image from the last post. You can see there are no peaks running up the right or the left (this would indicate detail lost in the blacks of the image. You can see the histogram is spread across the middle part of the graph, which is a classic good histogram shape (though a bit flat). This really is a little underexposed to me, since the flower in the image is white but the right side of the histogram is rather close to the center, but it's better than blowing out the whites and I can brighten it a little in Lightroom.
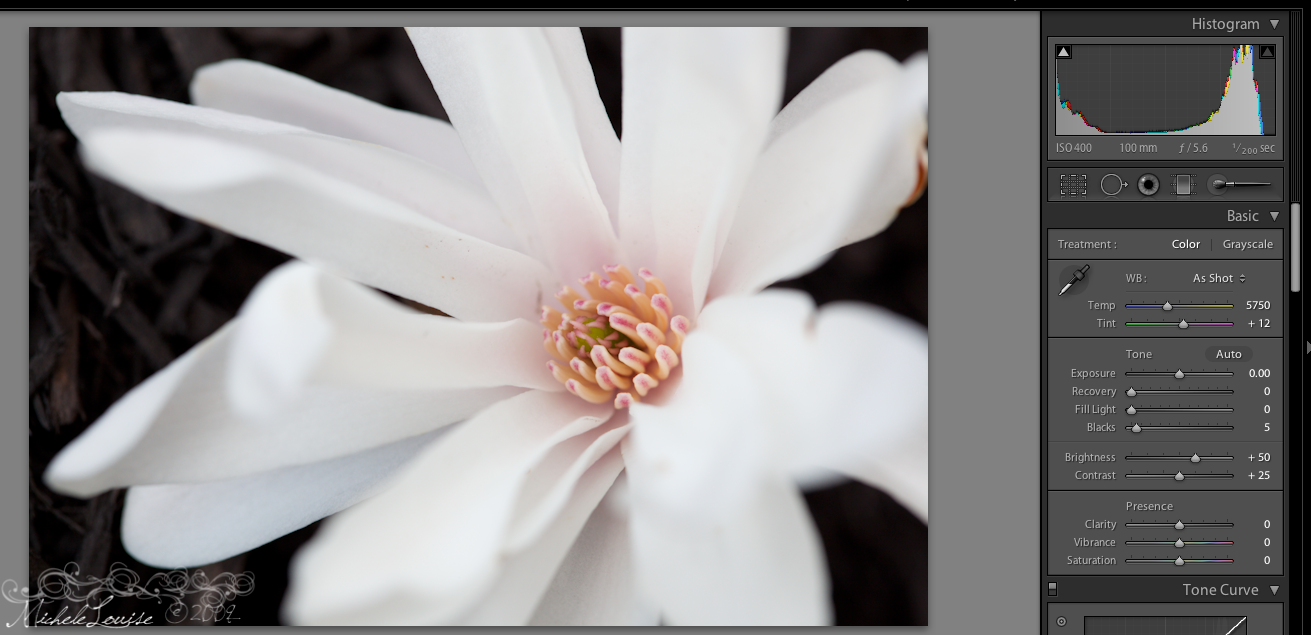
Here is one that looks a little like it breaks the rules as it is two peaks on the far ends, but if you look at the image, it makes sense, dark mulch and a bright white flower. There is a peak running up the left, that is the mulch but I don't care about having detail there, the mulch is not the subject of the image.
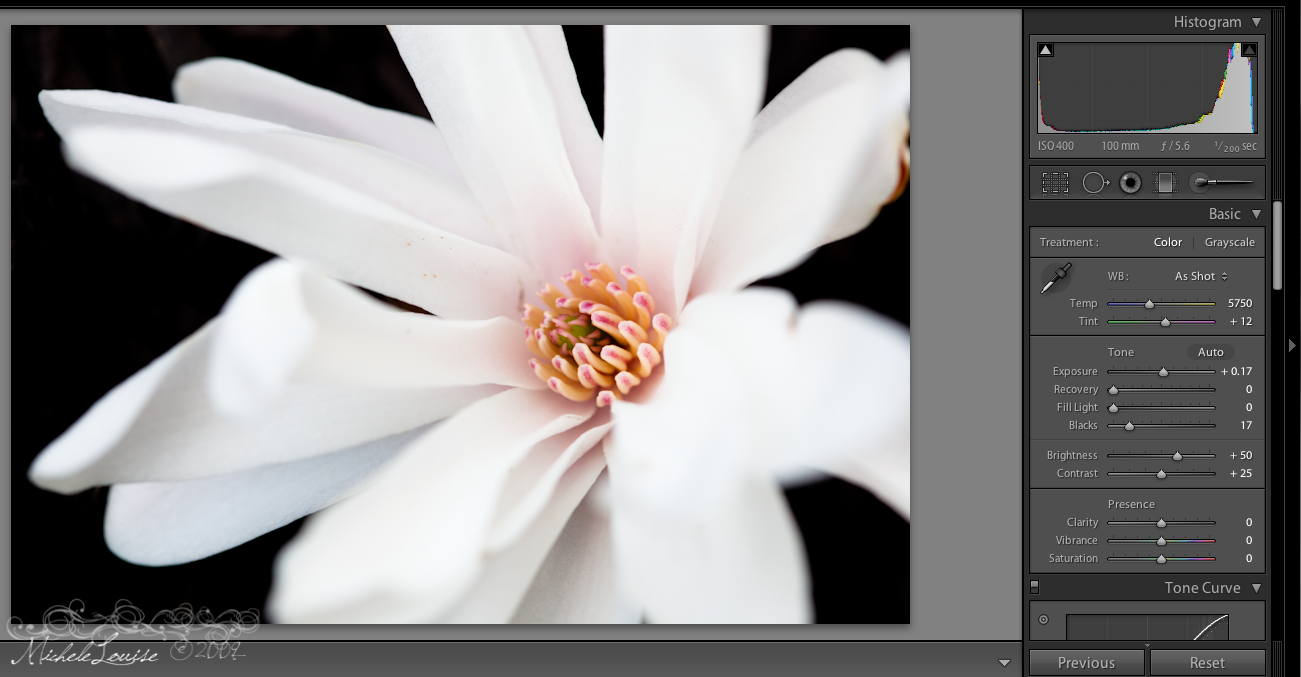
This is the edited version of the previous image. I brightened up the flower a bit, and darkened the mulch so now there is more running up the left, and the right peak is closer to white but not blown out.
I know that was a quick overview so if you want to read more about histograms and how to understand them, here are some of my favorite articles on the topic and related topics:
How to Use Histograms - Ken Rockwell
Camera Histograms: Tones and Contrast
Camera Histograms: Luminance and Color
Tutorials: Photoshop Levels
Understanding tonal range
Interpreting your Camera’s Histogram
How To Read An Image Histogram In Photoshop
No comments:
Post a Comment